
Financial Highlights

Performance Highlights
| 44th term | 45th term | 46th term | 47th term | 48th term | |
|---|---|---|---|---|---|
| FY1/22 | FY1/23 | FY1/24 | FY1/25 | FY1/26 | |
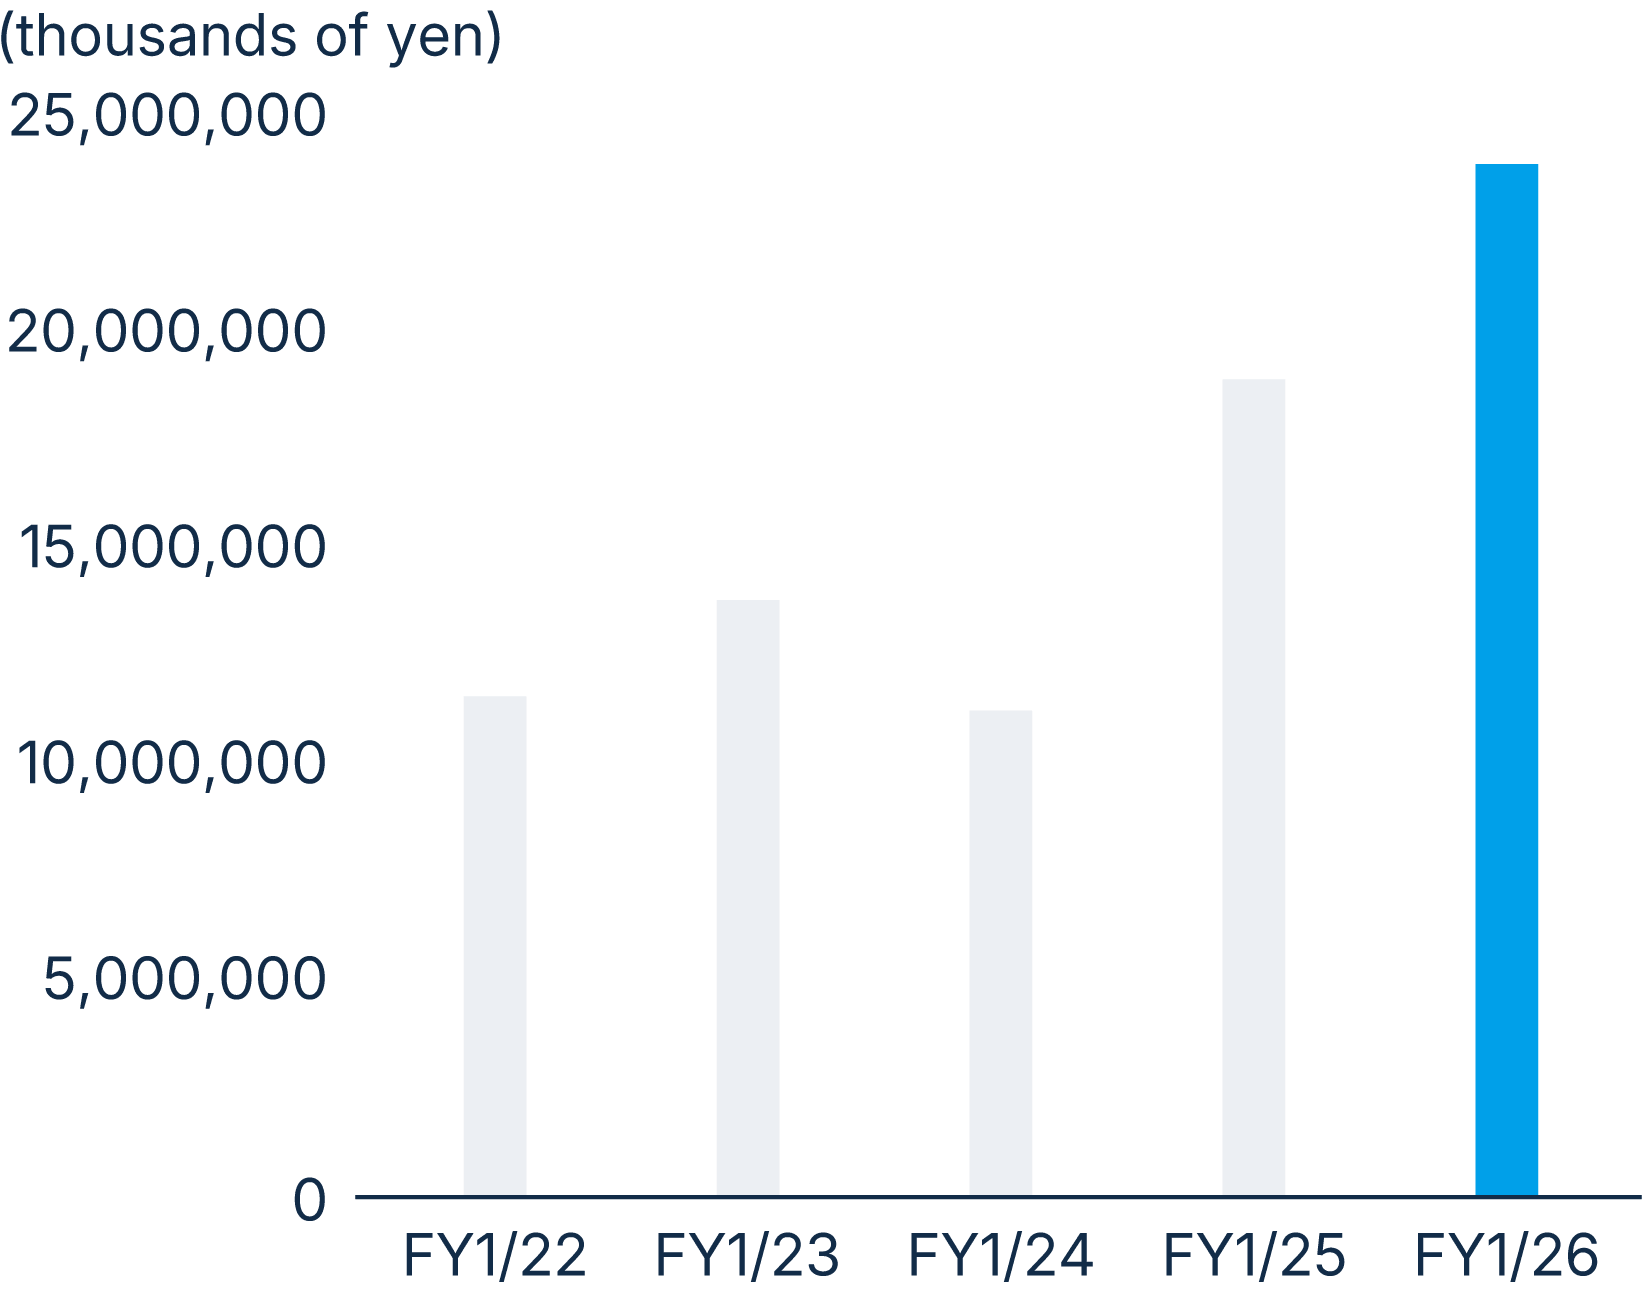
| Net sales (thousands of yen) | 11,574,455 | 13,803,392 | 11,246,293 | 18,905,888 | 23,883,175 |
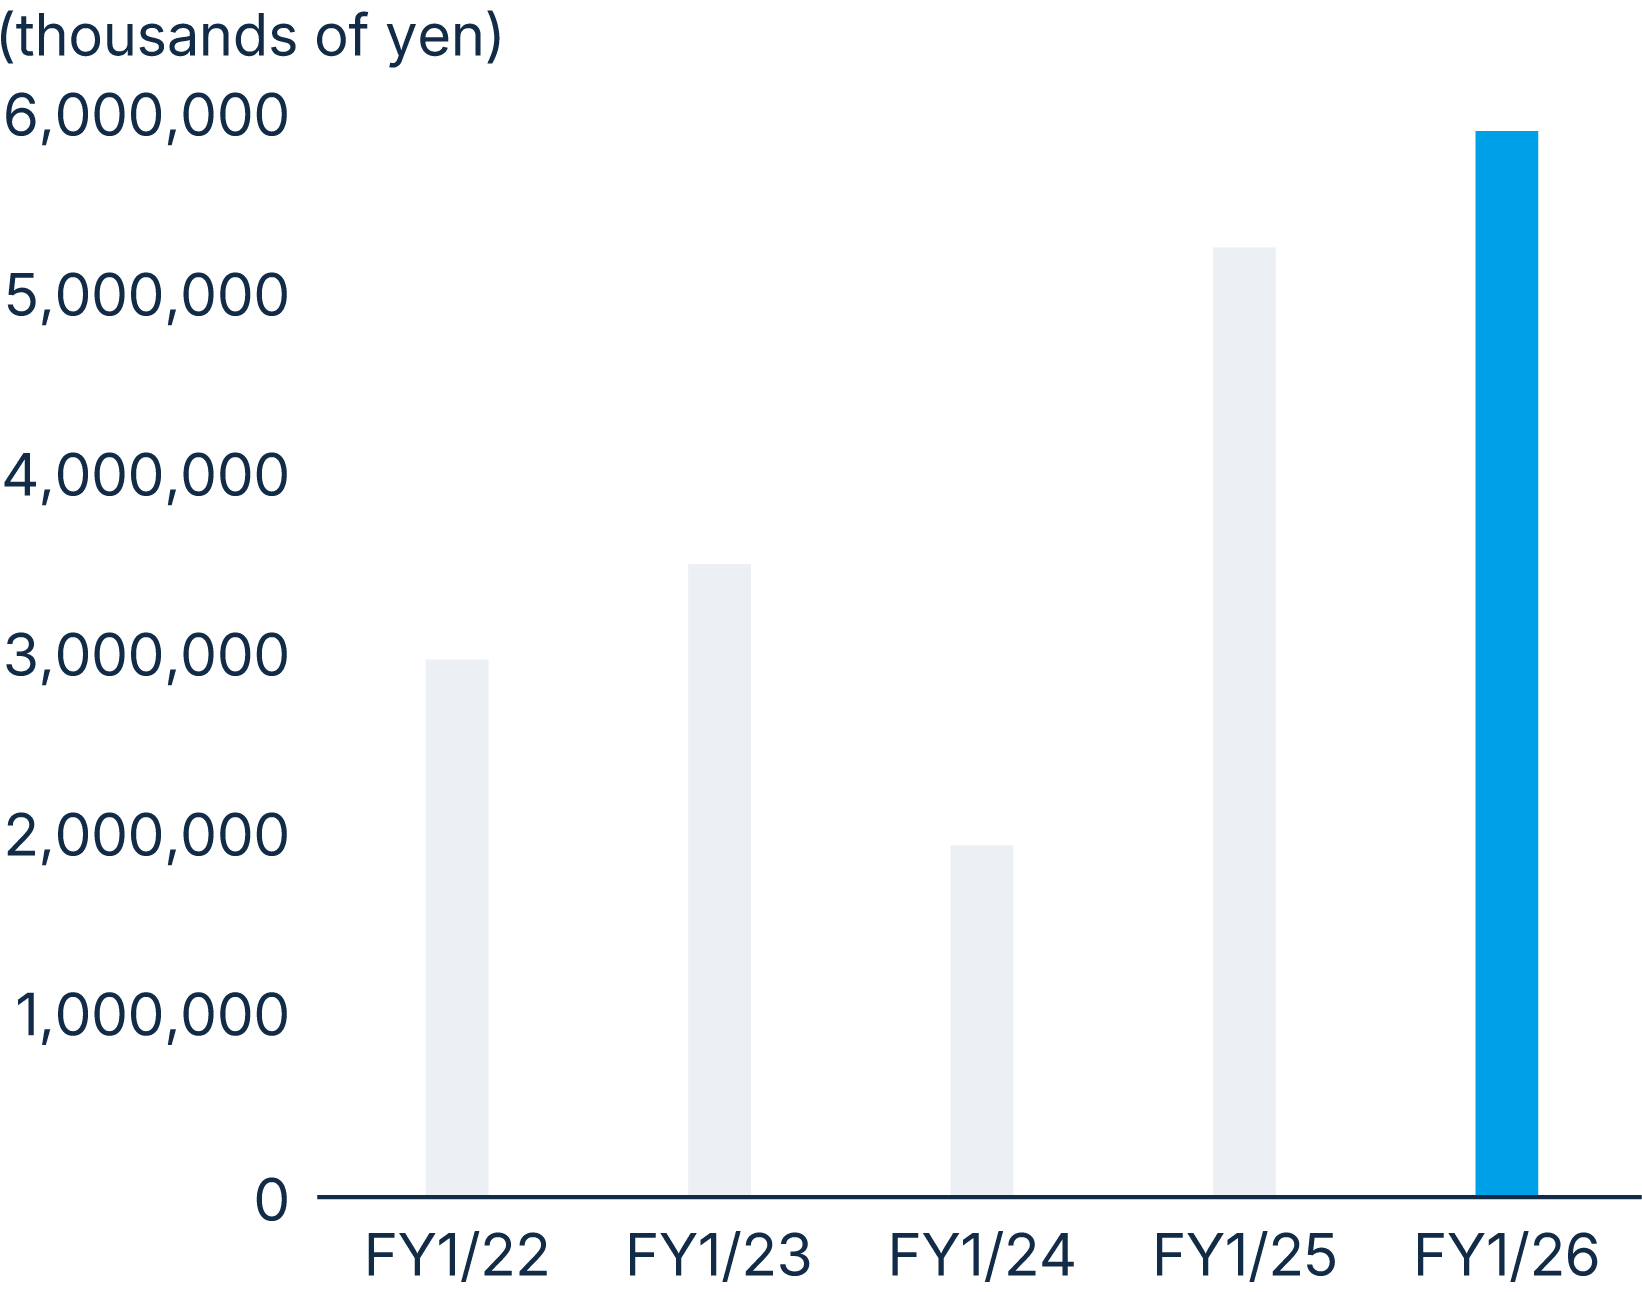
| Operating profit (thousands of yen) | 2,976,074 | 3,504,624 | 1,947,989 | 5,256,445 | 5,902,226 |
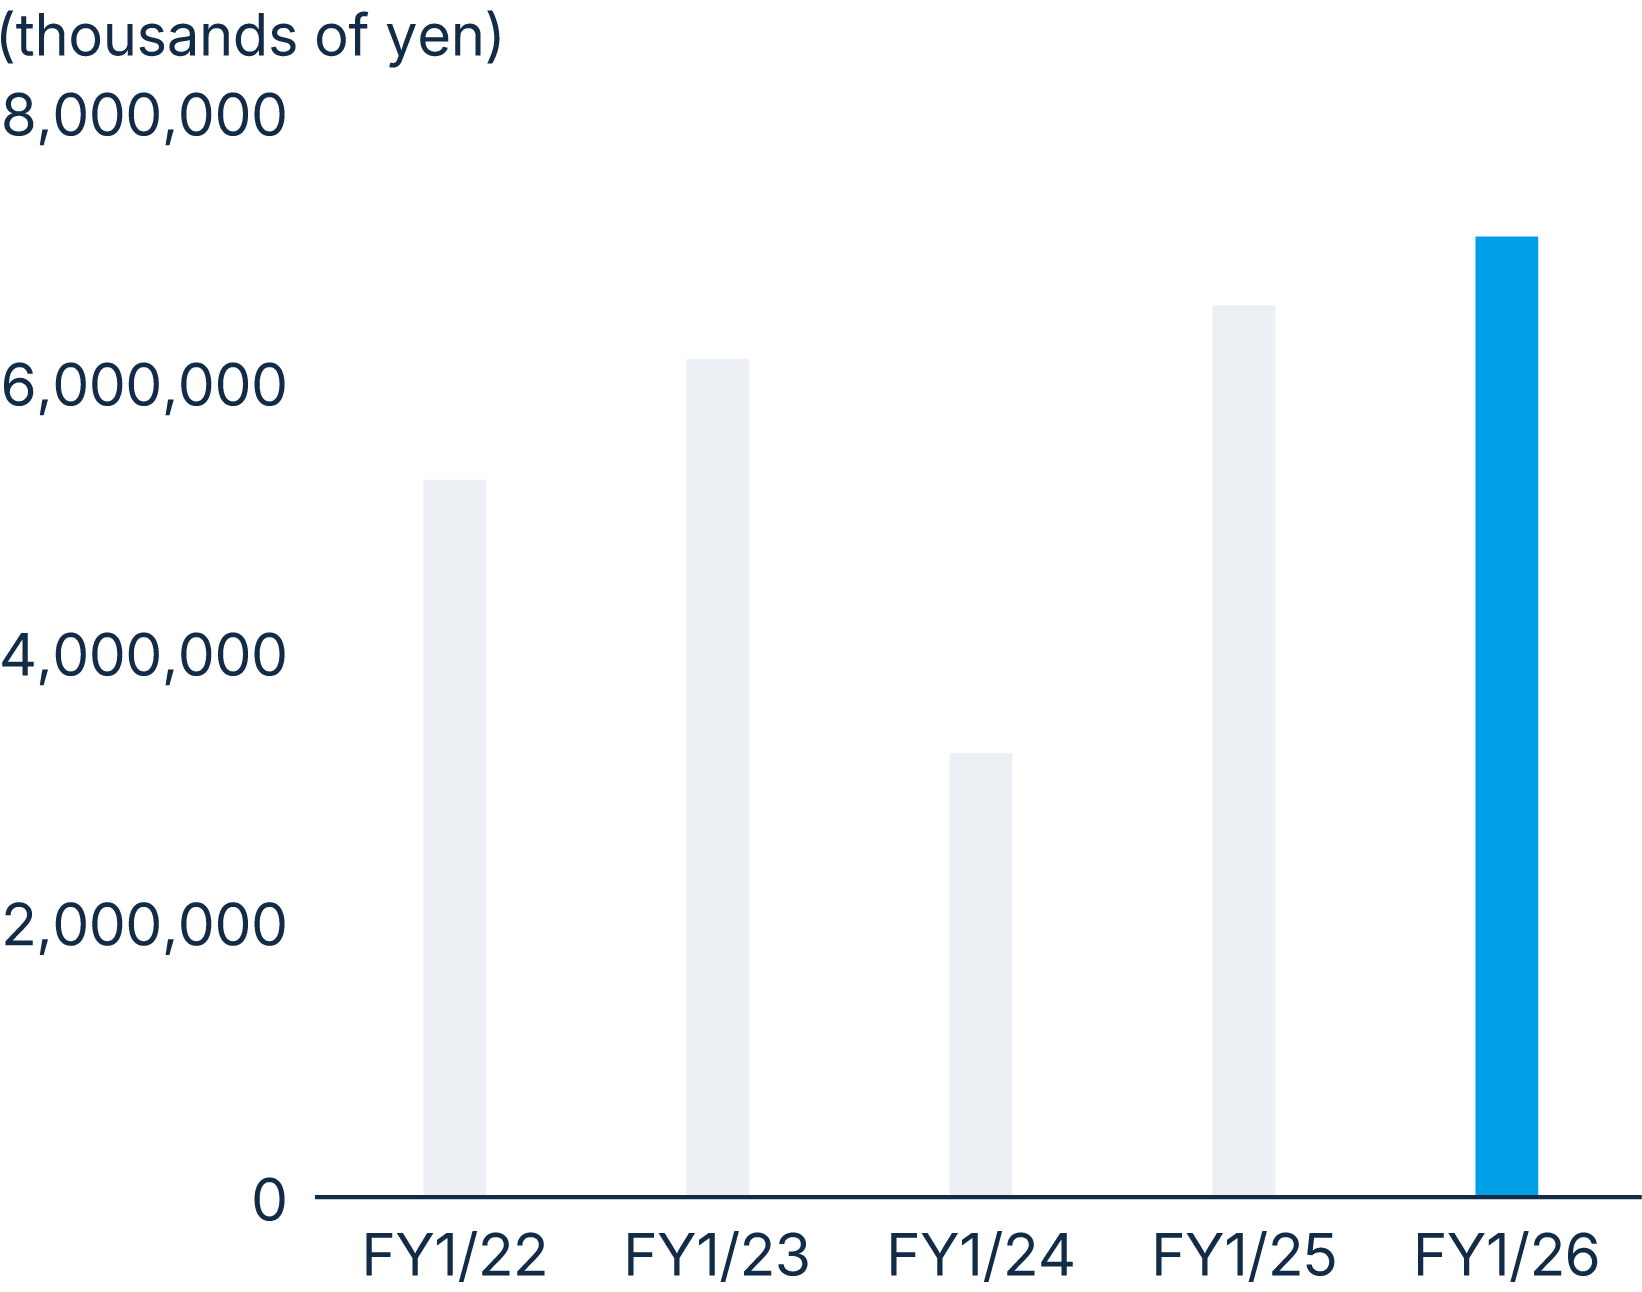
| Ordinary profit (thousands of yen) | 5,294,861 | 6,186,508 | 3,276,706 | 6,583,264 | 7,090,219 |
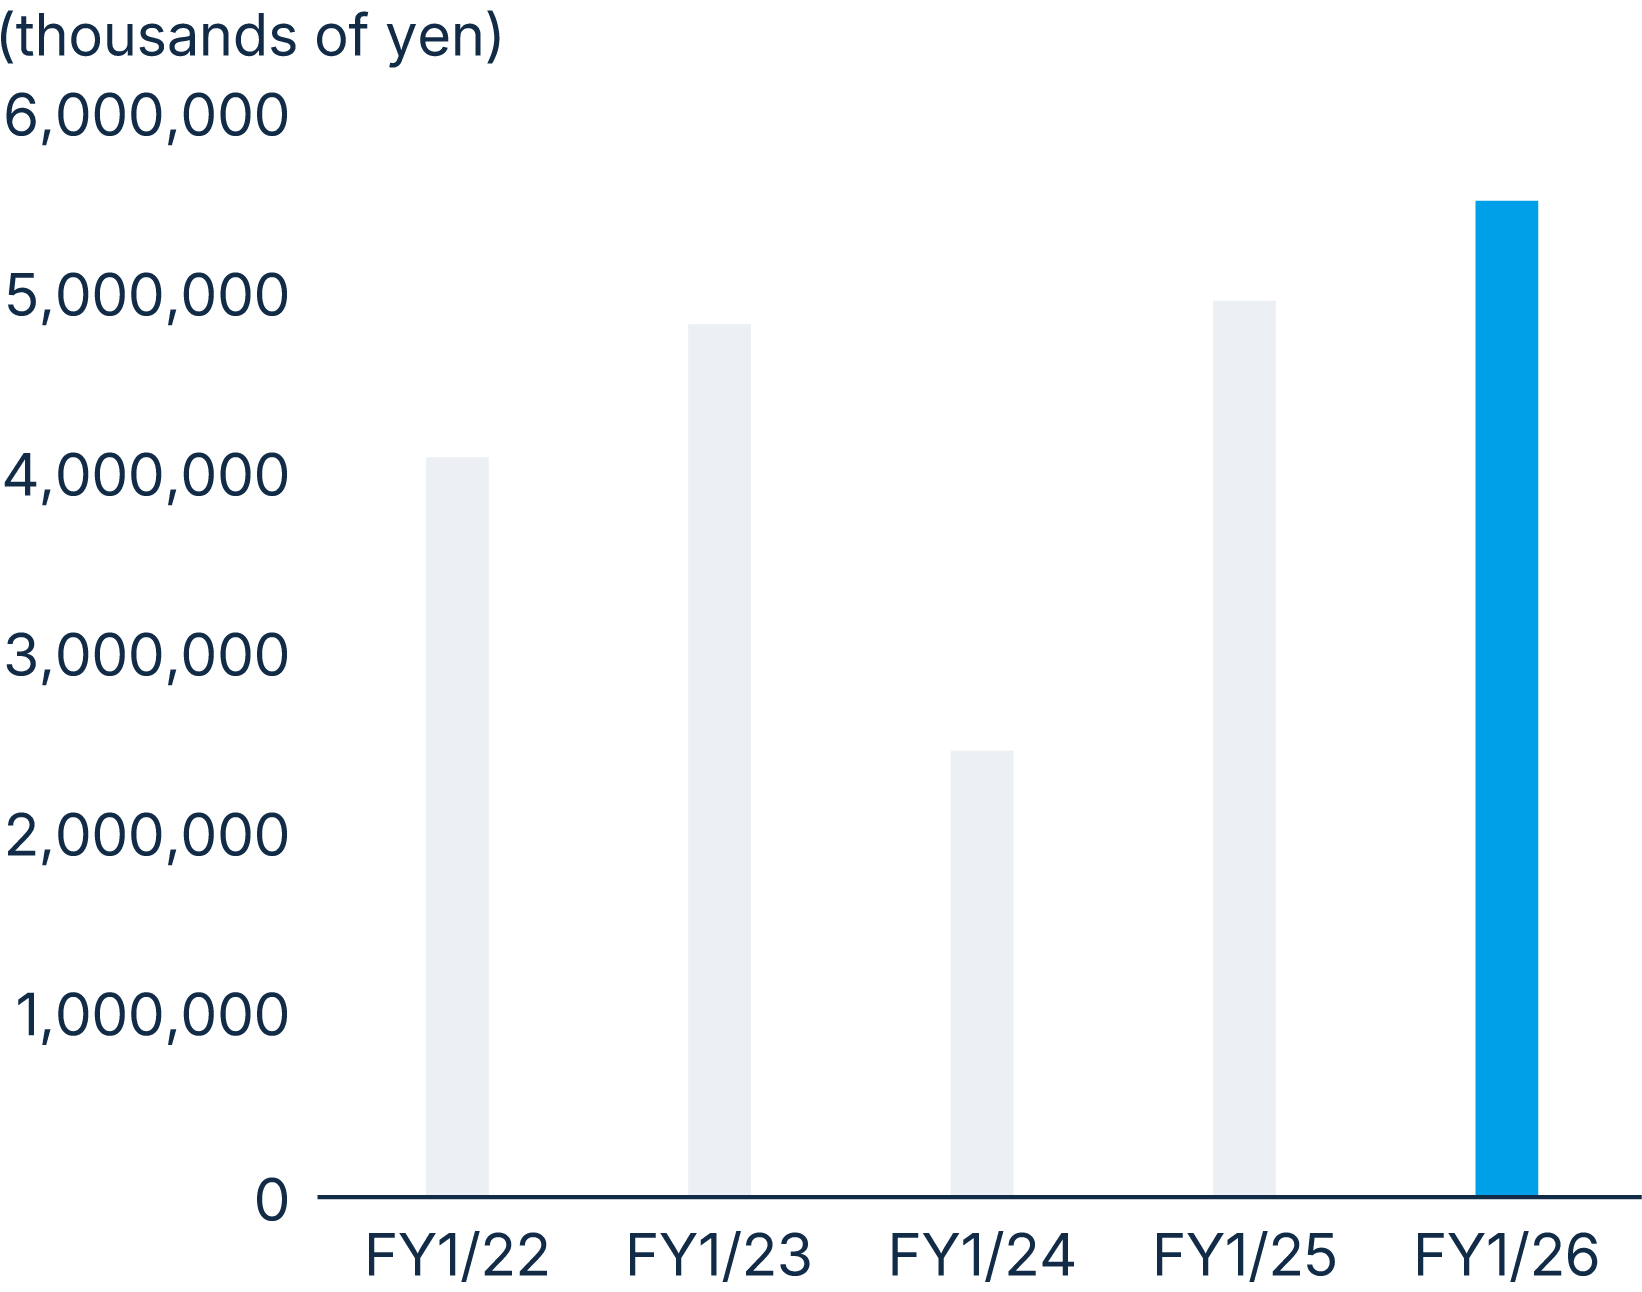
| Profit attributable to owners of parent (thousands of yen) | 4,095,086 | 4,832,417 | 2,470,625 | 4,961,998 | 5,515,240 |
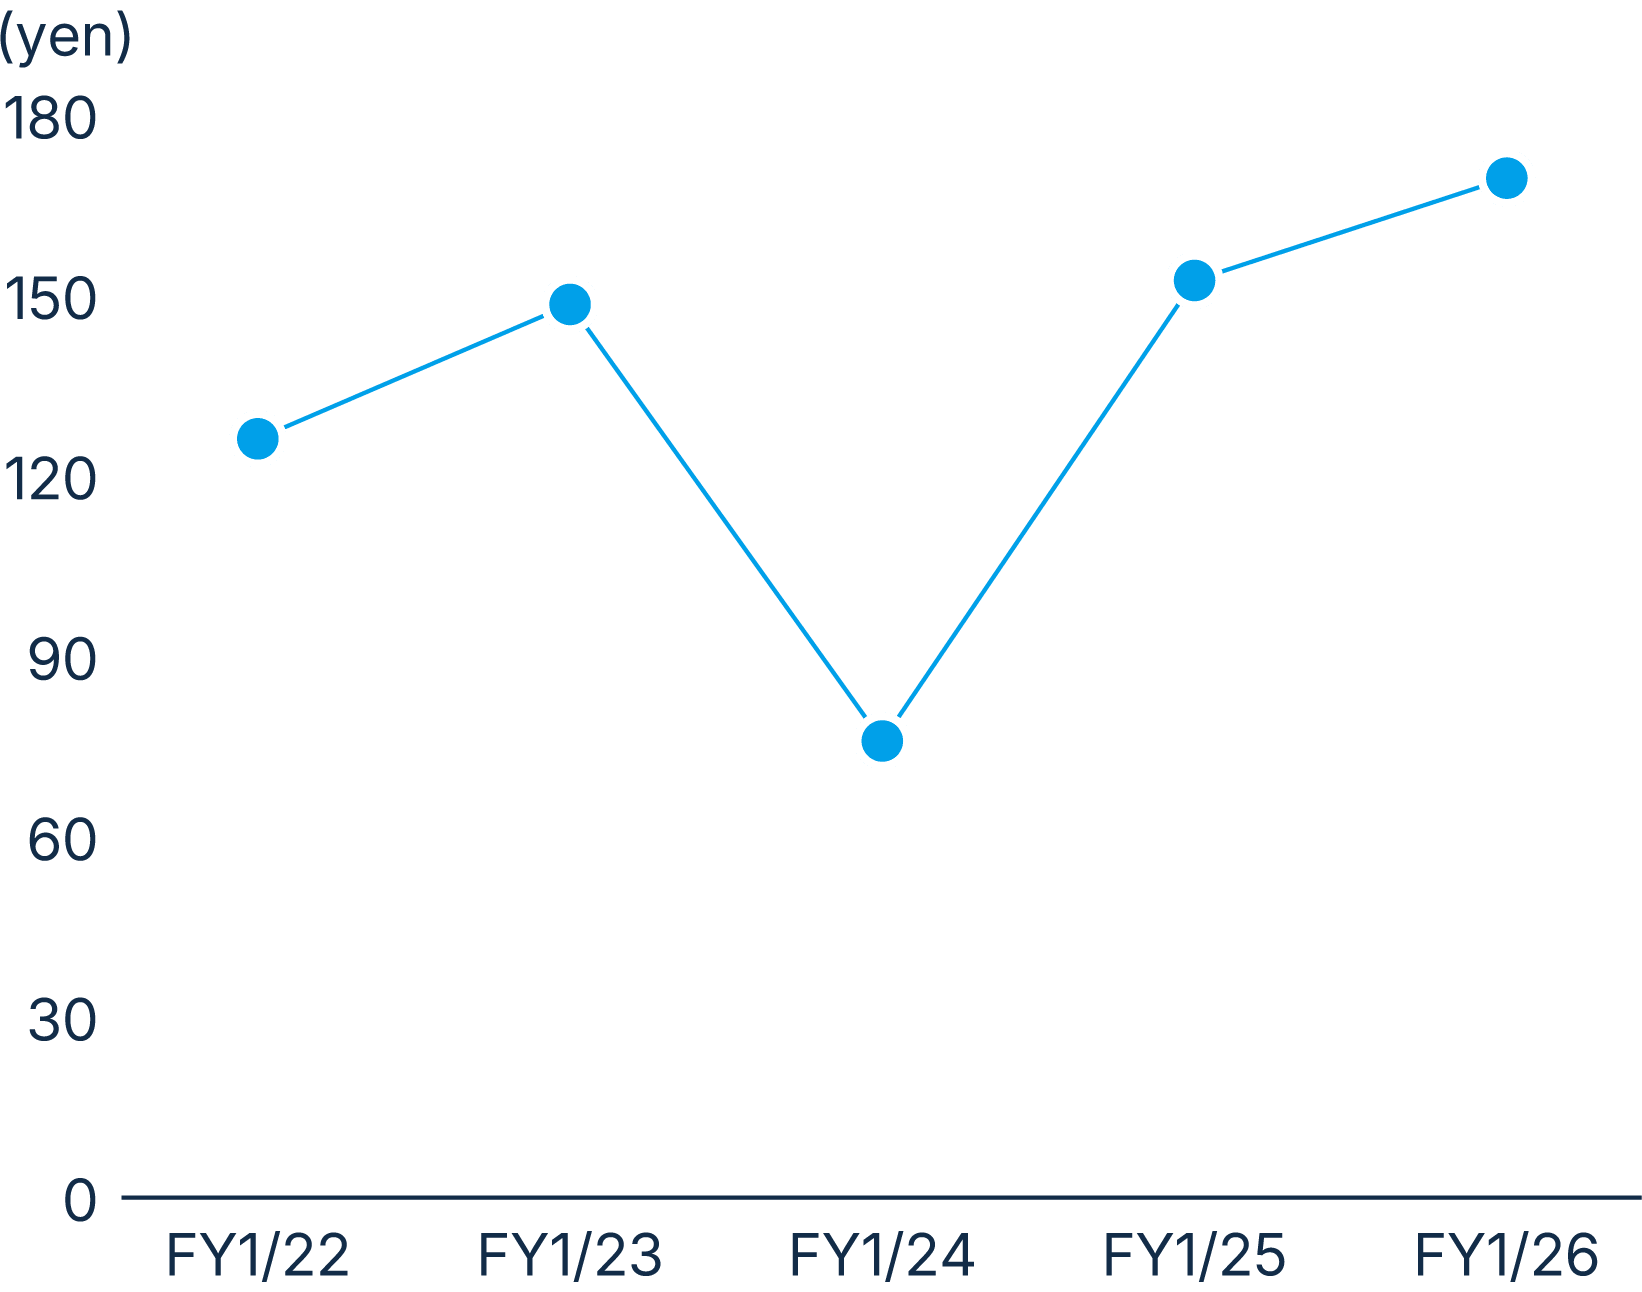
| Profit per share (yen) | 126.33 | 148.70 | 76.03 | 152.69 | 169.72 |
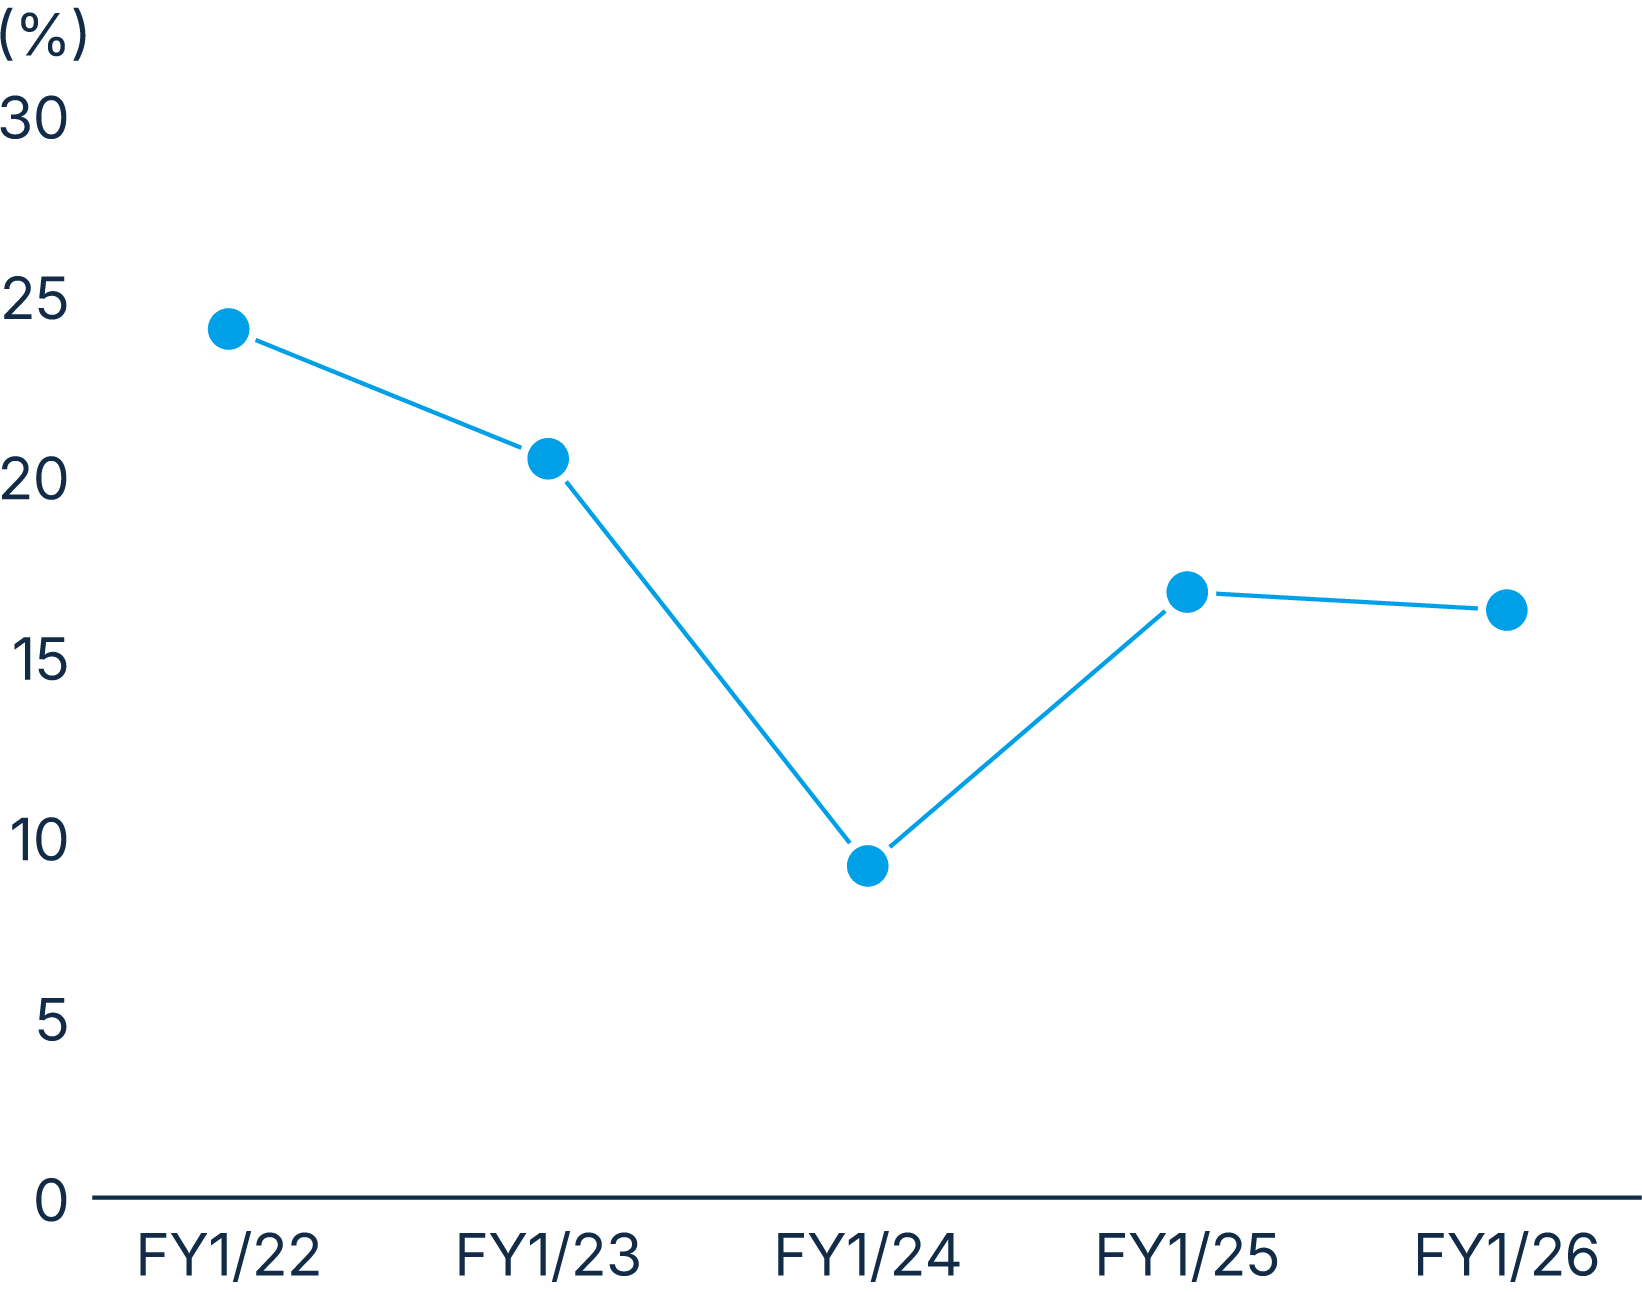
| ROE (%) | 24.1 | 20.5 | 9.2 | 16.8 | 16.3 |
Net sales
Operating profit
Ordinary profit
Profit attributable to owners of parent
Profit per share
ROE
Financial Situation
| 44th term | 45th term | 46th term | 47th term | 48th term | |
|---|---|---|---|---|---|
| FY1/22 | FY1/23 | FY1/24 | FY1/25 | FY1/26 | |
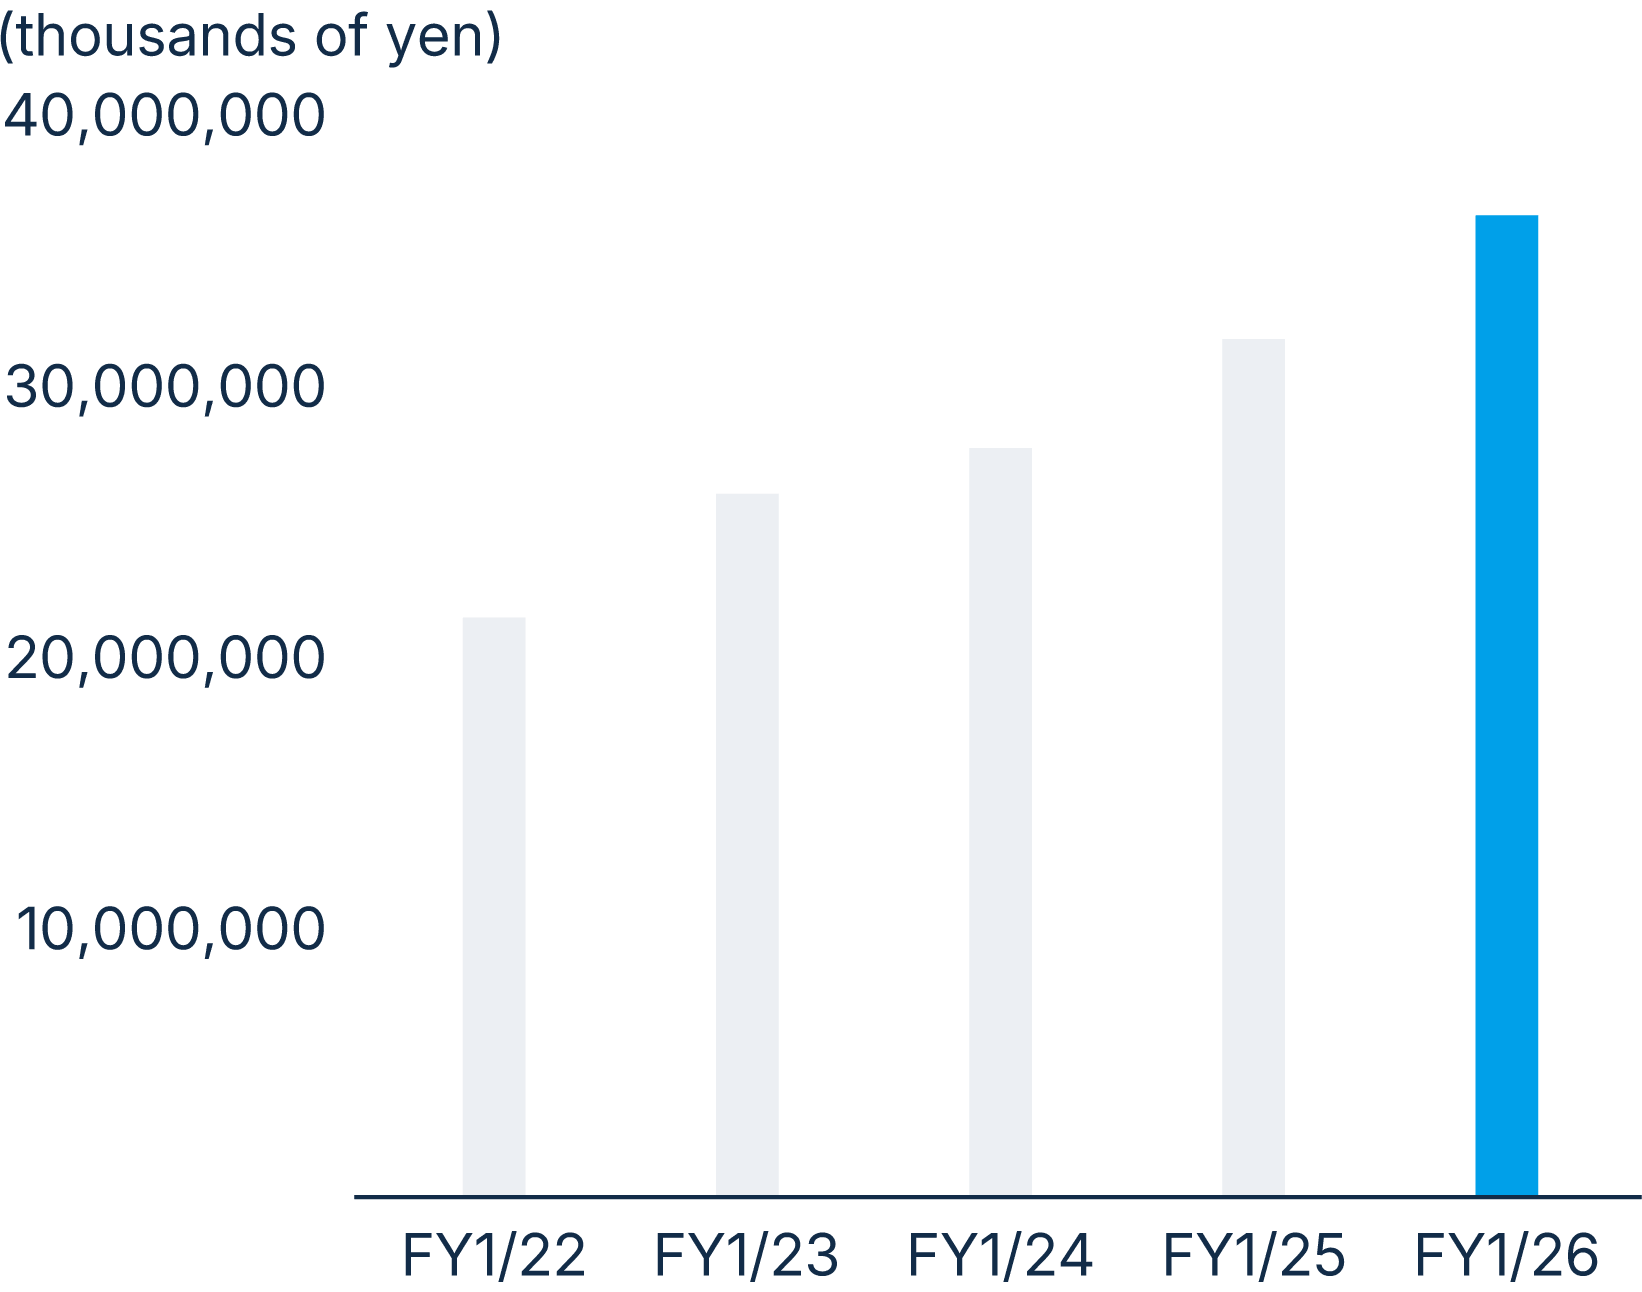
| Net assets (thousands of yen) | 21,320,399 | 25,876,060 | 27,570,415 | 31,587,684 | 36,149,551 |
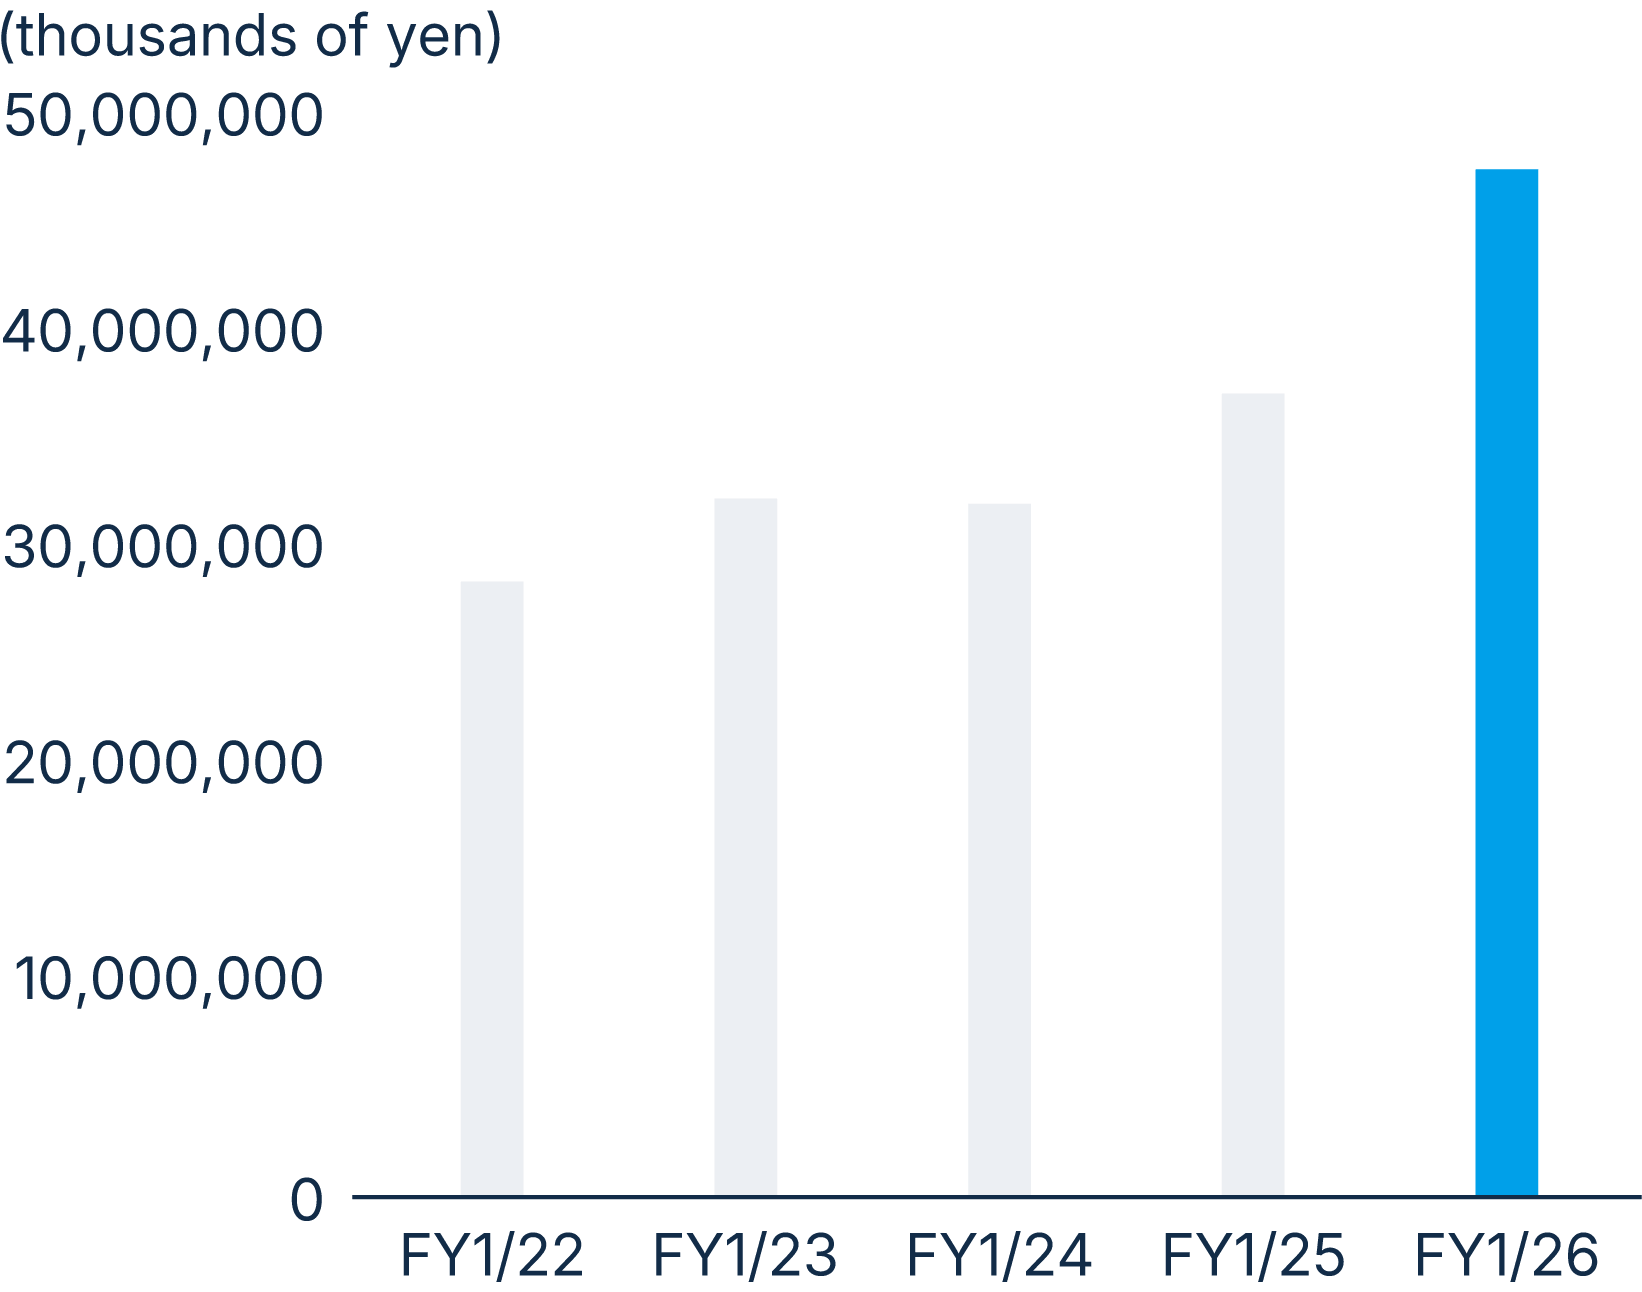
| Total assets (thousands of yen) | 28,288,937 | 32,115,559 | 31,864,933 | 36,944,588 | 47,274,965 |
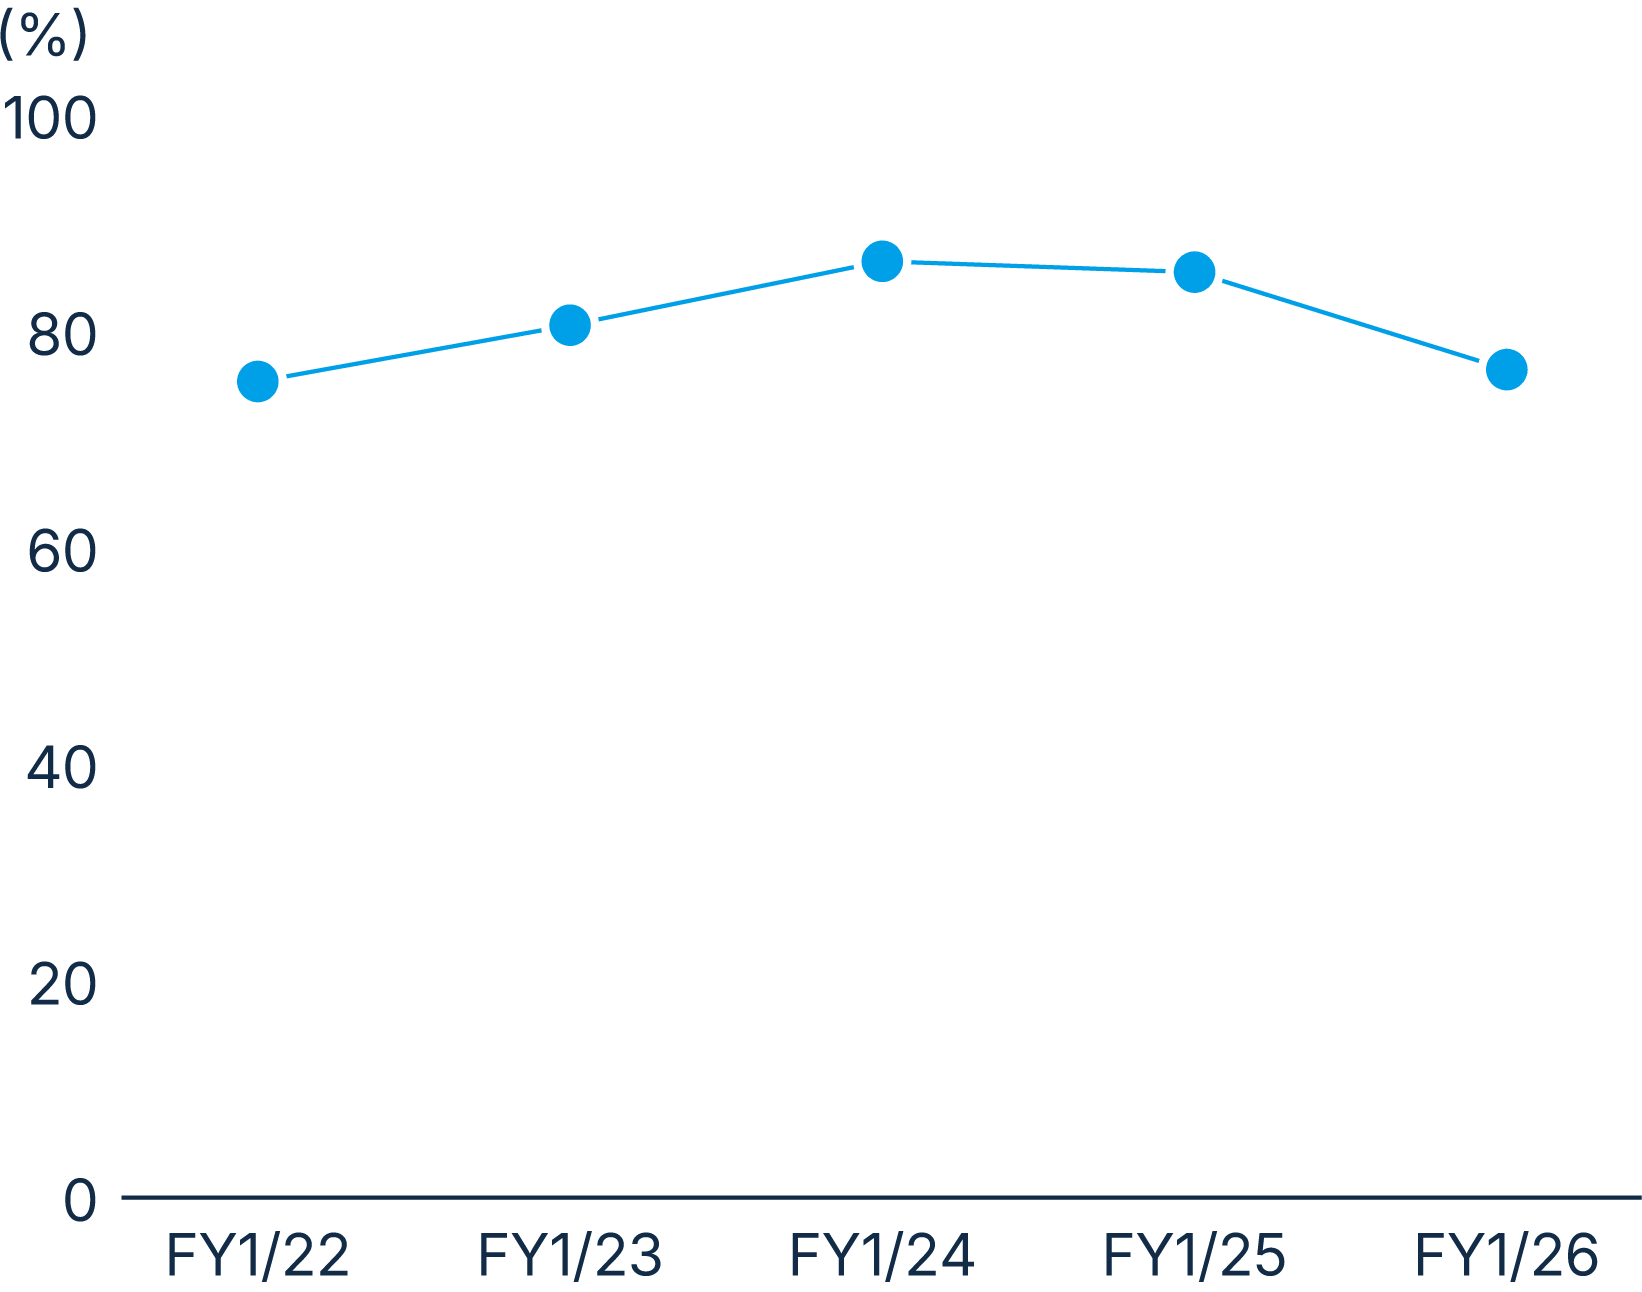
| Equity ratio (%) | 75.4 | 80.6 | 86.5 | 85.5 | 76.5 |
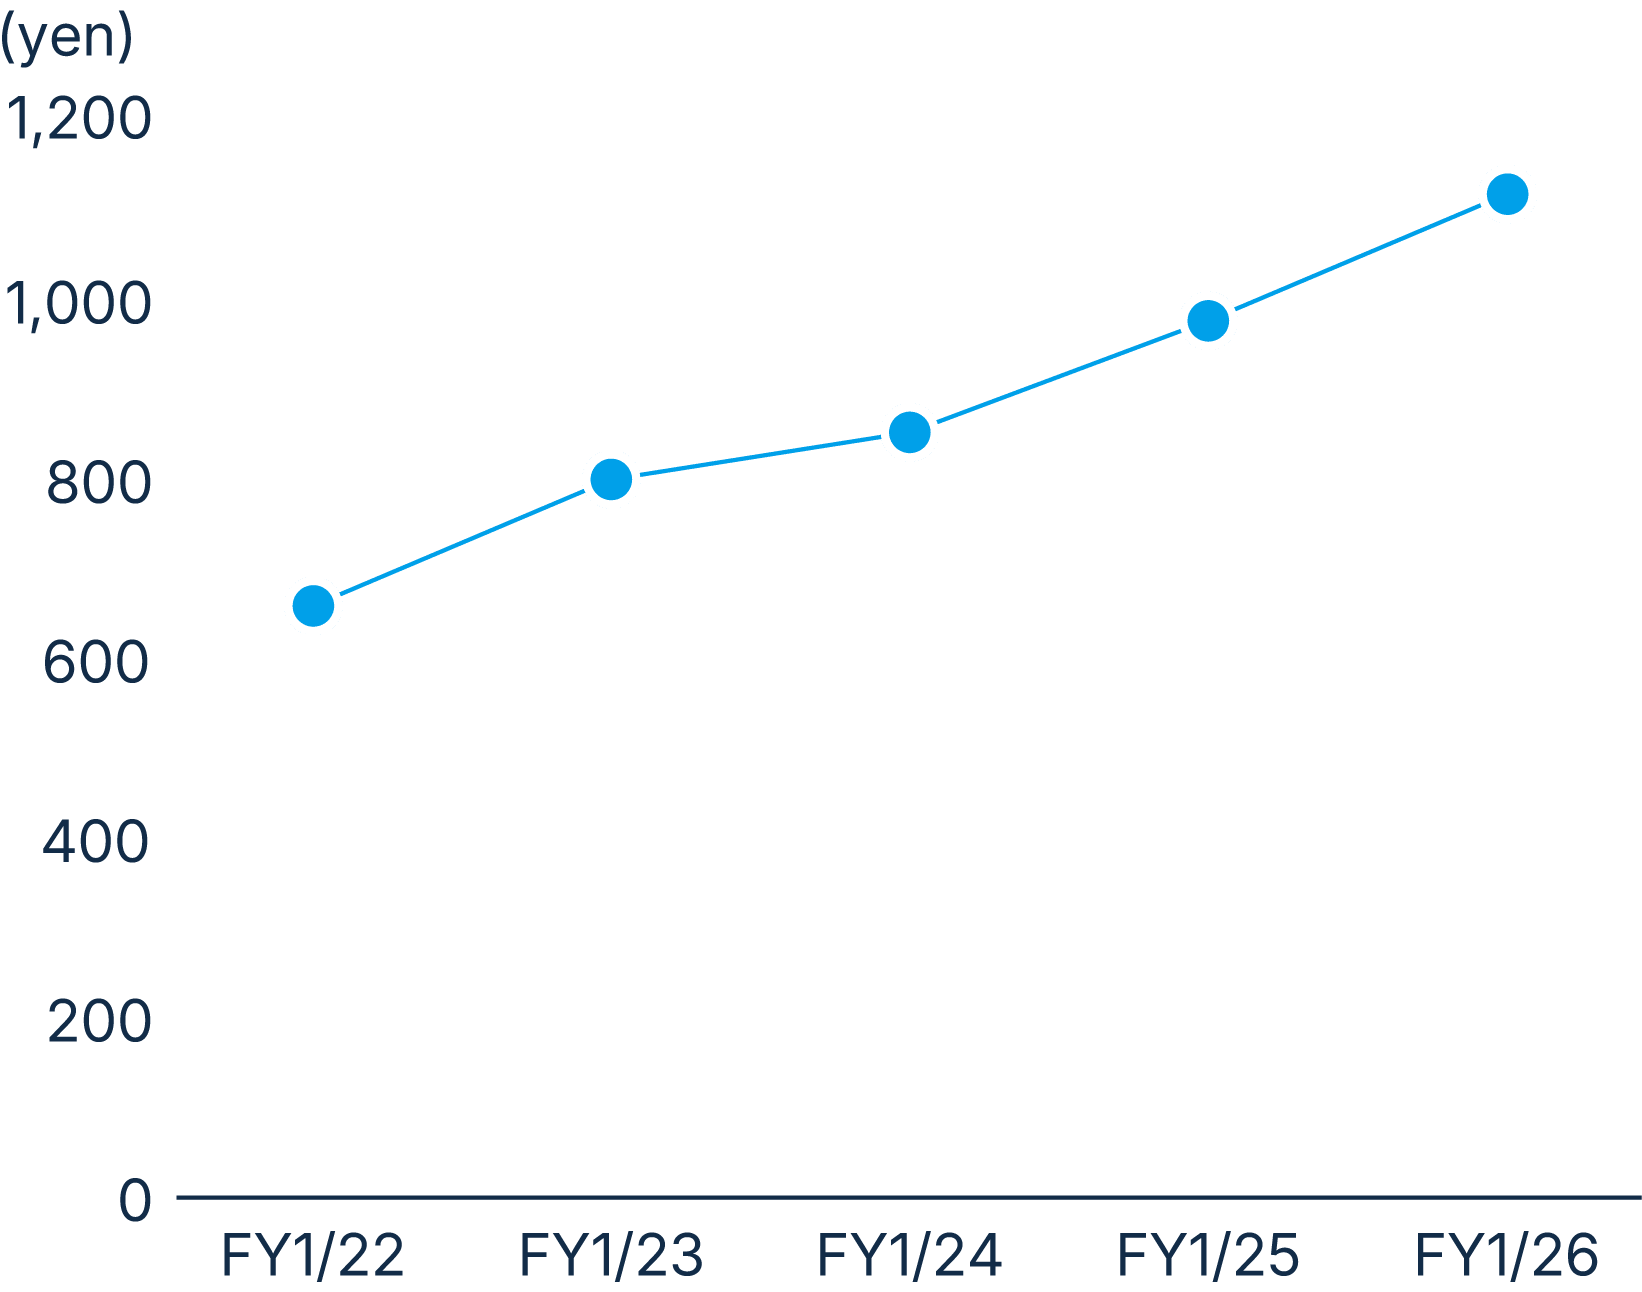
| Net assets per share (yen) | 656.07 | 796.26 | 848.40 | 972.02 | 1,112.41 |
Net assets
Total assets
Equity ratio
Net assets per share
Cash flow conditions
| 44th term | 45th term | 46th term | 47th term | 48th term | |
|---|---|---|---|---|---|
| FY1/22 | FY1/23 | FY1/24 | FY1/25 | FY1/26 | |
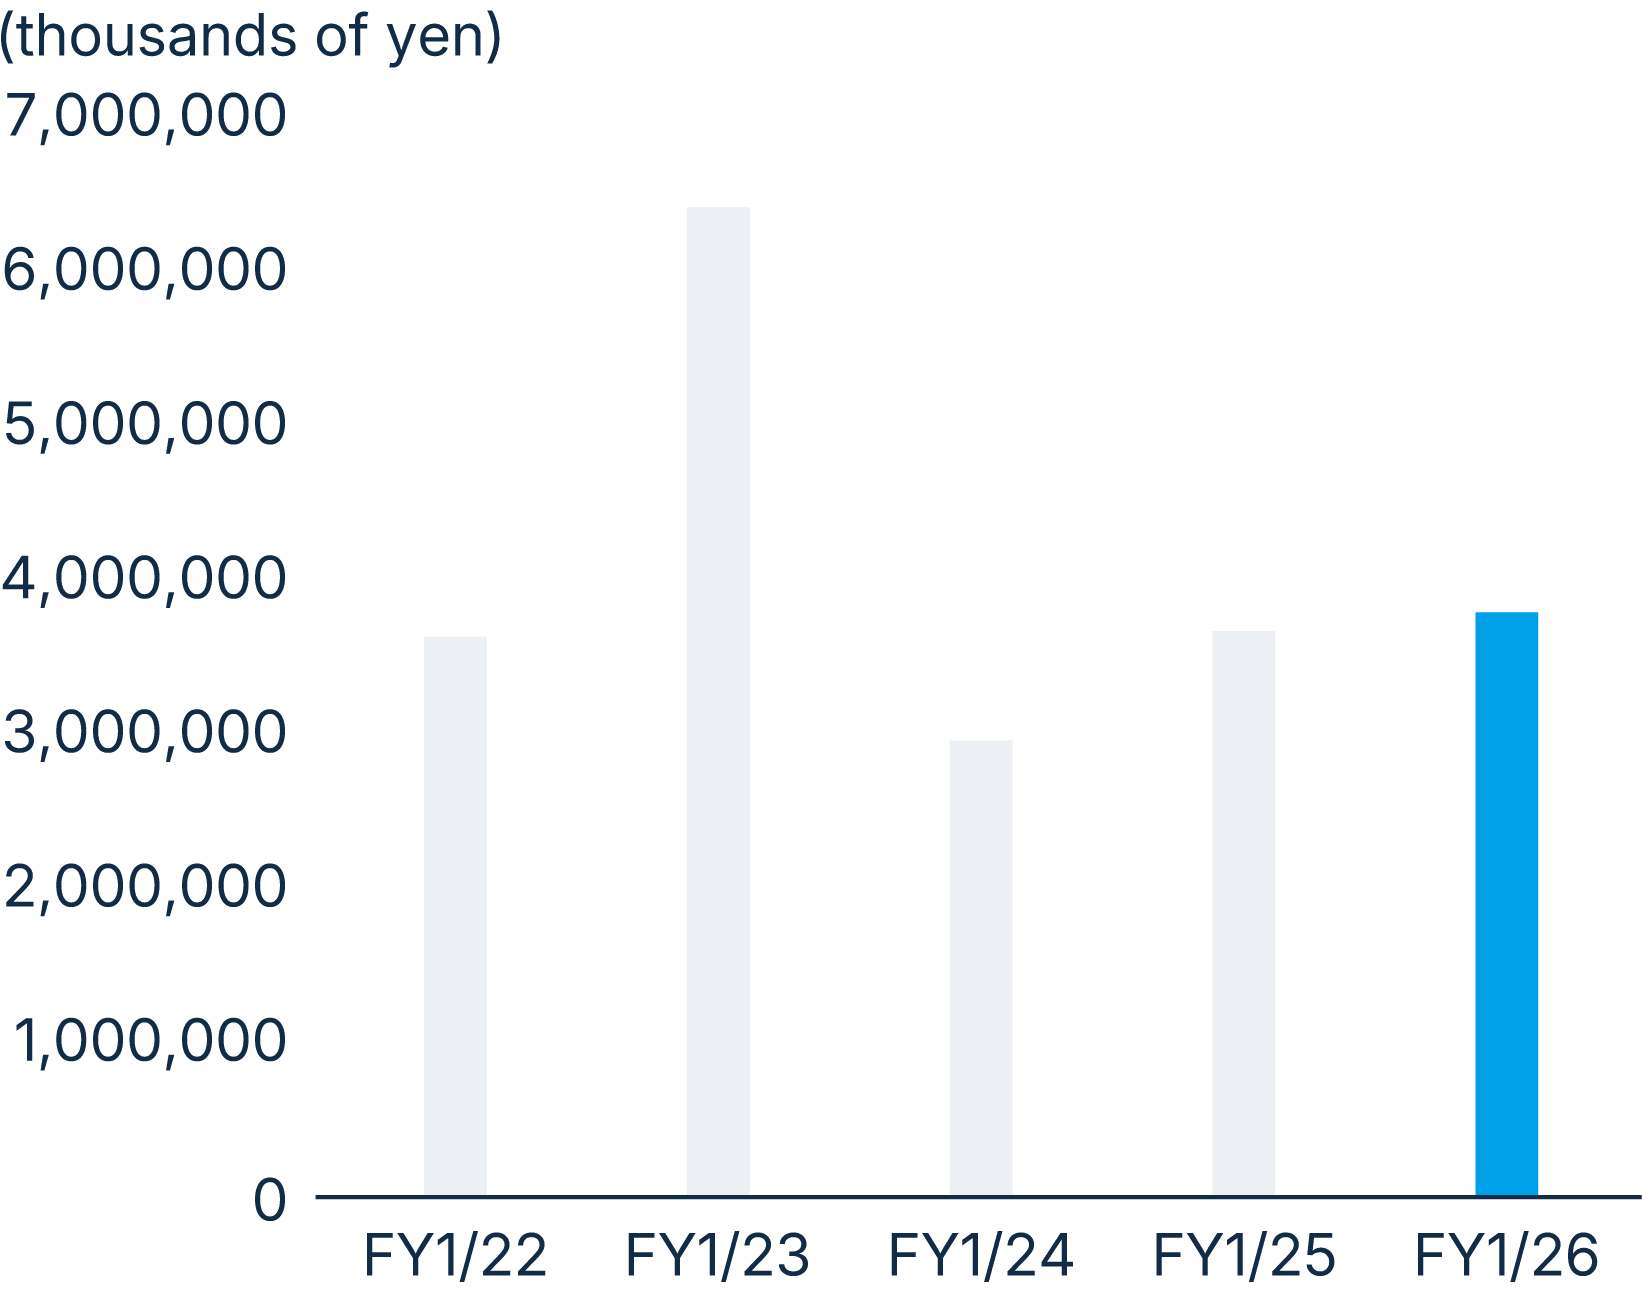
| Cash flows from operating activities (thousands of yen) | 3,638,626 | 6,392,057 | 2,972,015 | 3,675,110 | 3,795,166 |
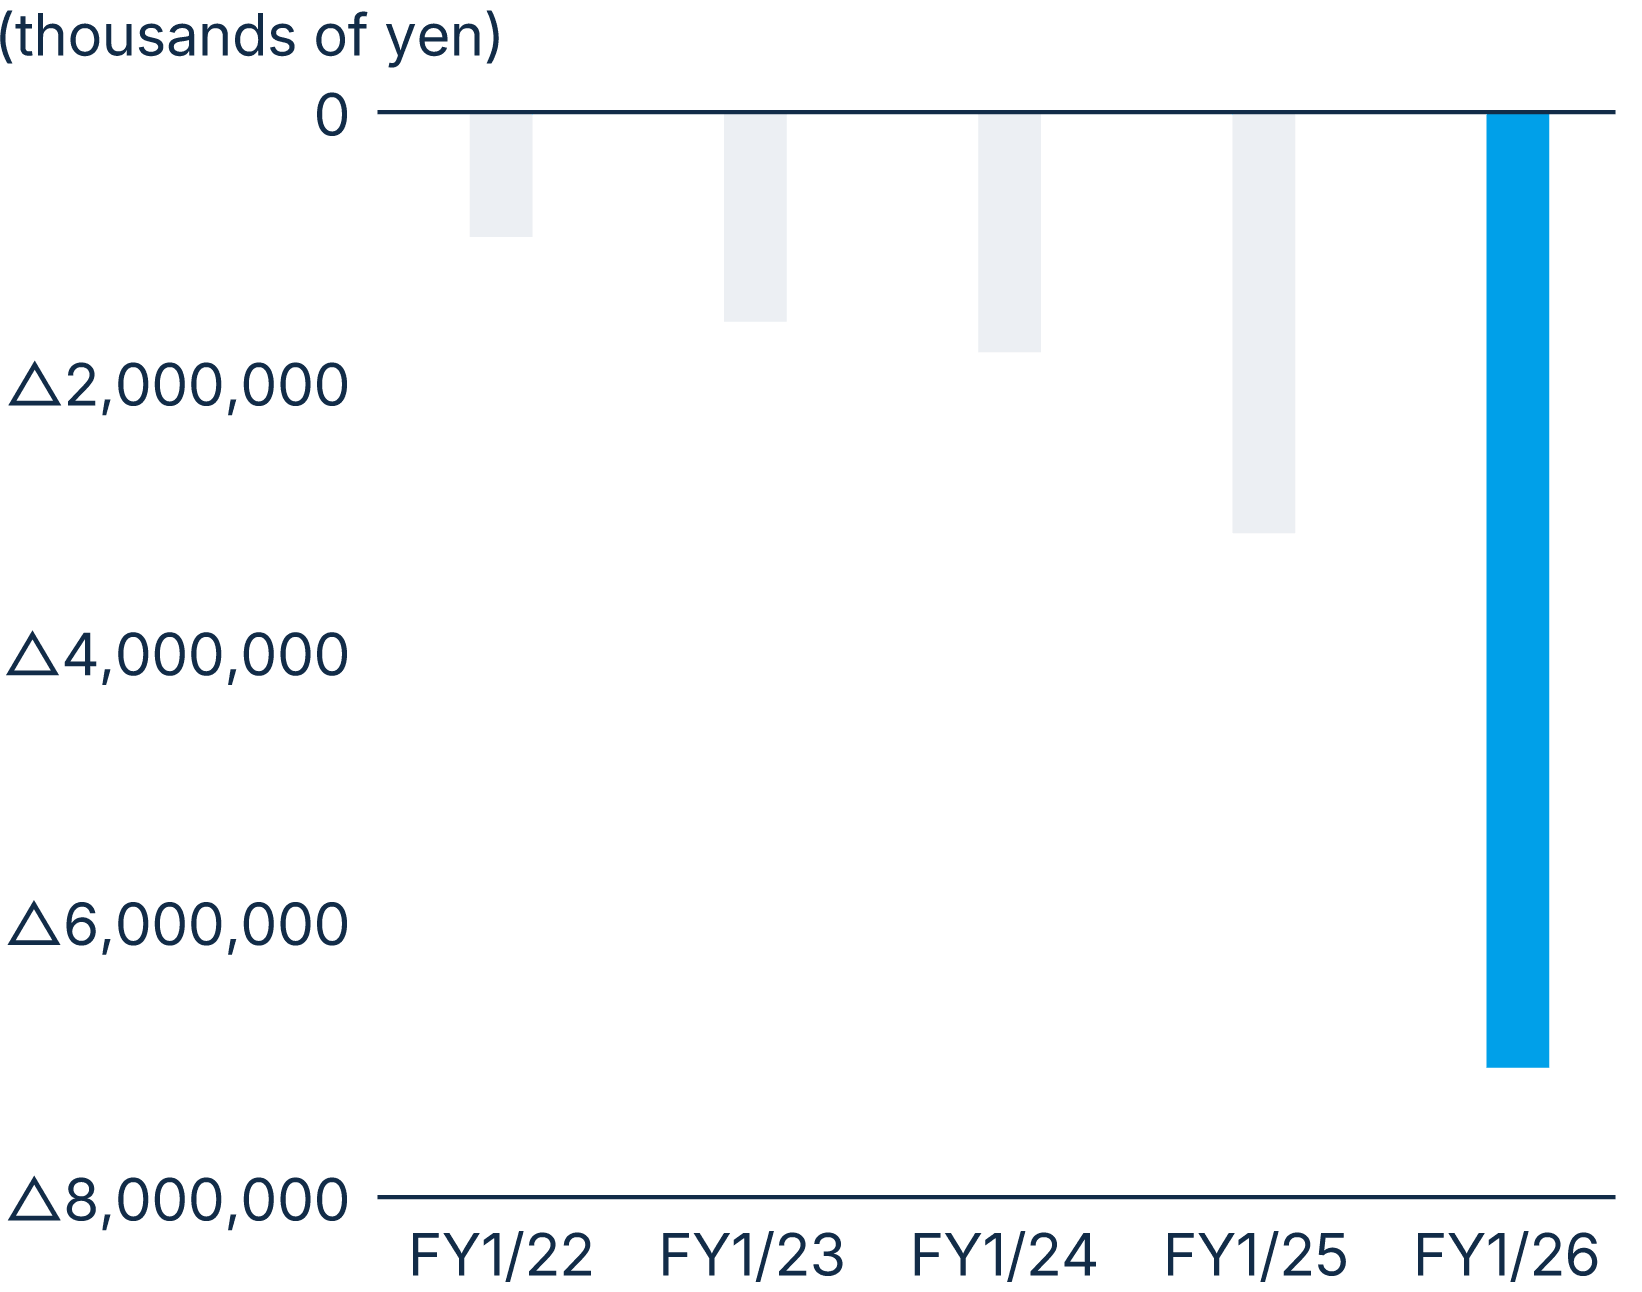
| Cash flows from investing activities (thousands of yen) | △932,880 | △1,557,570 | △1,781,833 | △3,116,065 | △7,054,145 |
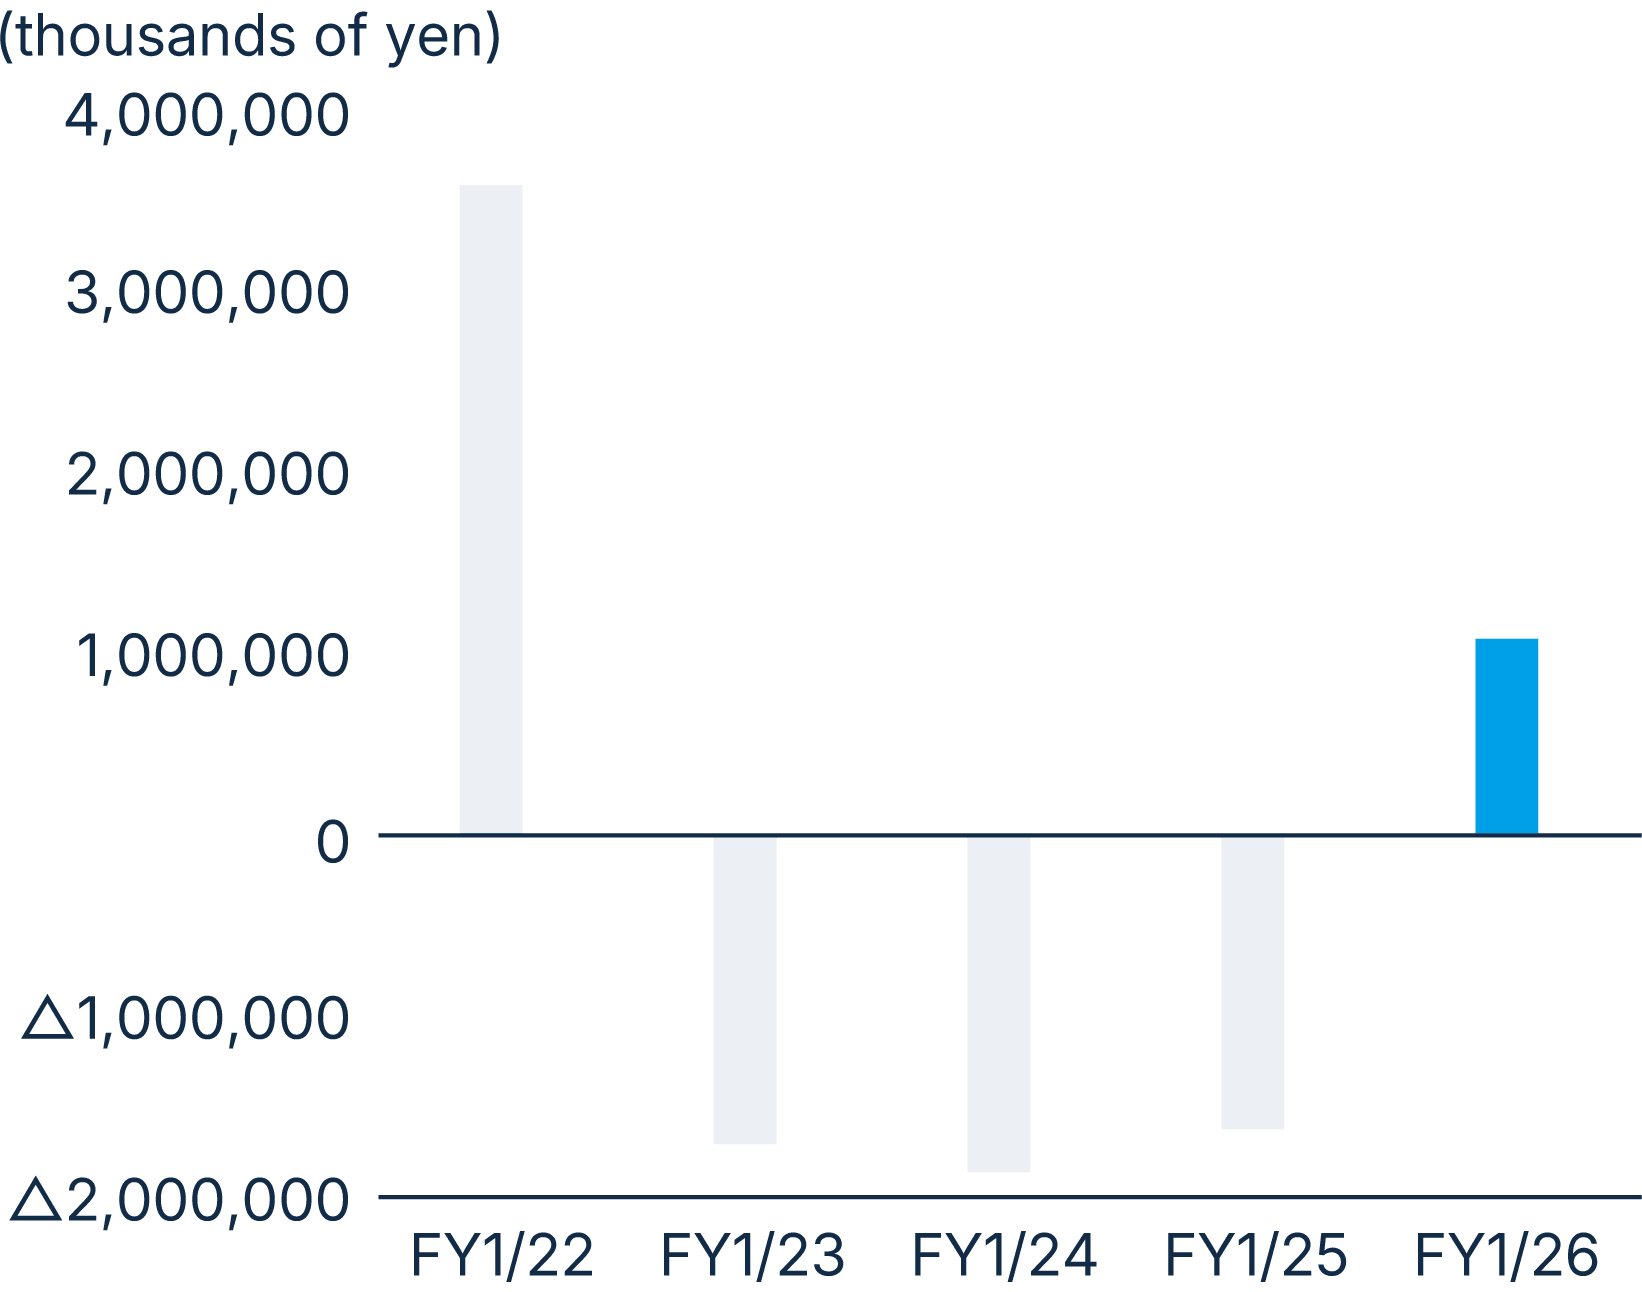
| Cash flows from financing activities (thousands of yen) | 3,594,427 | △1,703,583 | △1,858,875 | △1,620,462 | 1,088,296 |
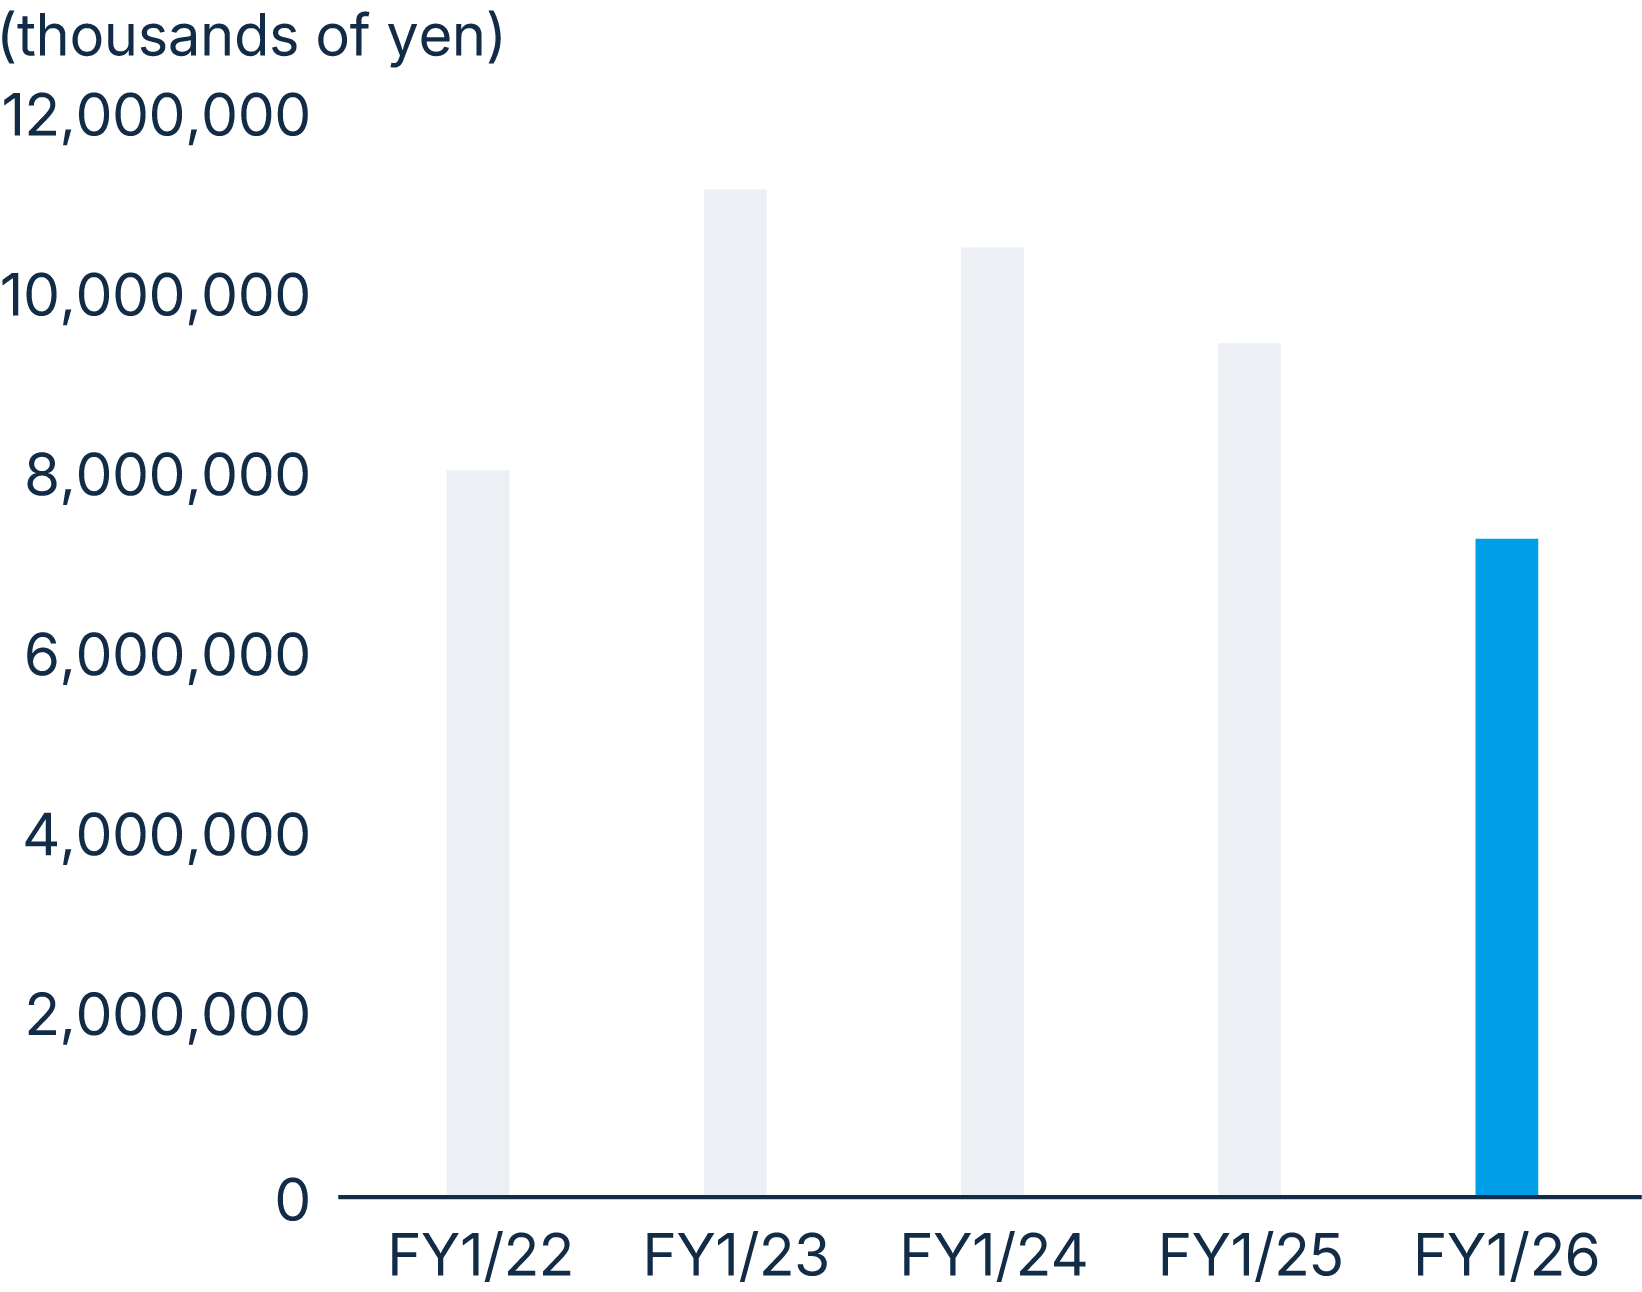
| Cash and cash equivalents at end of period (thousands of yen) | 8,034,494 | 11,137,800 | 10,497,345 | 9,439,328 | 7,279,978 |
Cash flows from operating activities
Cash flows from investing activities
Cash flows from financing activities
Cash and cash equivalents at end of period
Product and Service Inquiries, Quote Requests
Please use the link below for requests for quotes or inquiries regarding our products and services.